3 gnuplotを使ったグラフ表示
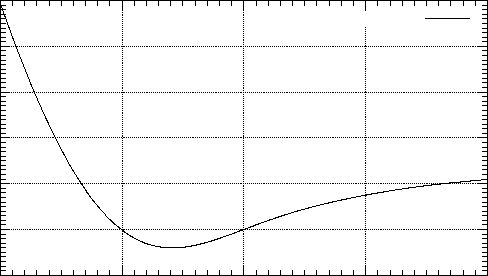
グラフ表示を行った後,二分法により方程式の解を計算するプログラムをリスト 2に示す.このプログラムを実行すると,図 1のようなグラフが表示された後,近似解が,answer = -1.5479375e+00と表示される
次年度以降,ここで学習したC言語の知識を他の科目で応用しようとする者は,このプロ グラムを理解せよ.そして,自分で書いて見よ.
![\begin{picture}(18000,10800)(0,0)%
\put(1650,1650){\makebox(0,0)[r]{\strut{}-3}}...
...\put(14950,9675){\makebox(0,0)[r]{\strut{}''out.txt'' using 1:2}}%
\end{picture}](img30.png)
   1 #include <stdio.h>
   2 #include <math.h>
   3 #define EPSILON (1.0e-10)
   4
   5 double function(double x);
   6 double bisection(double (*f)(), double left, double right);
   7 void mk_data(char *a, double (*f)(), double x1, double x2, int n);
   8 void mk_graph(char *f, char *xlb, double x1, double x2,
   9 	      char *ylb, double y1, double y2);
  10
  11 /*==========================================================*/
  12 /*   main function                                          */
  13 /*==========================================================*/
  14 int main(void){
  15
  16   double left, right, ans;
  17
  18   left=-2.0;
  19   right=2.0;
  20
  21   mk_data("out.txt", &function, left, right, 1000);
  22   mk_graph("out.txt", "x", left, right, "y", -3, 3);
  23
  24   ans = bisection(&function, left, right);
  25
  26   printf("answer = %12.7e\n",ans);
  27
  28   return 0;
  29 }
  30
  31 /*==========================================================*/
  32 /*  to be solved equation.  f(x)=0                          */
  33 /*==========================================================*/
  34 double function(double x){
  35   double y;
  36
  37   y=x*cos(x)+sin(x)+exp(-x*x)+x*x-x-3;
  38
  39   return y;
  40 }
  41
  42 /*==========================================================*/
  43 /*  bisection method f(x)=0                                 */
  44 /*==========================================================*/
  45 double bisection(double (*f)(), double left, double right){
  46   double temp, mid;
  47
  48   /*---- left と right が逆の場合 -------*/
  49
  50   if(left > right){
  51     temp = left;
  52     left = right;
  53     right = temp;
  54   }
  55
  56   //  while(right-left > EPSILON){
  57   while(right-left > EPSILON){
  58     mid = (left+right)/2.0;
  59
  60     if(f(left)*f(mid) >= 0){
  61       left = mid;
  62     }else{
  63       right = mid;
  64     }
  65
  66   }
  67
  68    return (left+right)/2.0;
  69 }
  70
  71 /*==========================================================*/
  72 /*   make a data file                                       */
  73 /*==========================================================*/
  74 void mk_data(char *a, double (*f)(double), double x1, double x2, int n){
  75   double x, y, dx;
  76   int i;
  77   FILE *out;
  78
  79   dx = (x2-x1)/n;
  80
  81   out = fopen(a, "w");
  82
  83   for(i=0; i<=n; i++){
  84     x = x1+dx*i;
  85     y = f(x);
  86
  87     fprintf(out, "%e\t%e\n", x, y);
  88   }
  89
  90   fclose(out);
  91 }
  92
  93 /*==========================================================*/
  94 /*   make a graph                                           */
  95 /*==========================================================*/
  96 void mk_graph(char *f, char *xlb, double x1, double x2,
  97 	      char *ylb, double y1, double y2){
  98
  99   FILE *gp;
 100
 101   gp = popen("gnuplot -persist","w");
 102
 103   fprintf(gp, "reset\n");
 104
 105   /* -------  set x grid ---------*/
 106
 107   fprintf(gp, "set grid\n");
 108
 109   /* -------  set x axis ---------*/
 110
 111   fprintf(gp, "set xtics 1\n");
 112   fprintf(gp, "set mxtics 10\n");
 113   fprintf(gp, "set xlabel \"%s\"\n", xlb);
 114   fprintf(gp, "set nologscale x\n");
 115   fprintf(gp, "set xrange[%e:%e]\n", x1, x2);
 116
 117   /* -------  set y axis ---------*/
 118
 119   fprintf(gp, "set ytics 1\n");
 120   fprintf(gp, "set mytics 10\n");
 121   fprintf(gp, "set ylabel \"%s\"\n", ylb);
 122   fprintf(gp, "set nologscale y\n");
 123   fprintf(gp, "set yrange[%e:%e]\n", y1, y2);
 124
 125         /* -------  plat graphs ---------*/
 126
 127   fprintf(gp, "set terminal x11\n");
 128
 129   fprintf(gp, "plot \"%s\" using 1:2 with line\n", f);
 130
 131   fprintf(gp, "set terminal epslatex\n");
 132   fprintf(gp, "set output \"function.eps\"\n");
 133
 134   fprintf(gp, "replot\n");
 135
 136   pclose(gp);
 137 }
ホームページ: Yamamoto's laboratory
著者: 山本昌志 Yamamoto Masashi
2006-02-27